UDI barCandle has been divide into 3 types up bar, down bar and inside bar,
These bar classified comparing previous candle high low to current candle close.
This method used to ride the trend without exiting position.
We can use this candle color as a stop loss and take profit.
Previous candle H&L Vs Cur. Candle Close
I
U
D
------------------------
I - Inside Candle
U - Up Candle
D - Down Candle
Cerca negli script per "inside bar"

US Market Long Horizon Momentum Summary in one paragraph
US Market Long Horizon Momentum is a trend following strategy for US index ETFs and futures built around a single eighteen month time series momentum measure. It helps you stay long during persistent bull regimes and step aside or flip short when long term momentum turns negative.
Scope and intent
• Markets. Large cap US equity indices, liquid US index ETFs, index futures
• Timeframes. 4h/ Daily charts
• Default demo used in the publication. SPY on 4h timeframe chart
• Purpose. Provide a minimal long bias index timing model that can reduce deep drawdowns and capture major cycles without parameter mining
• Limits. This is a strategy. Orders are simulated on standard candles only
Originality and usefulness
• Unique concept or fusion. One unscaled multiple month log return of an external benchmark symbol drives all entries and exits, with optional volatility targeting as a single risk control switch.
• Failure mode addressed. Fully passive buy and hold ignores the sign of long horizon momentum and can sit through multi year drawdowns. This script offers a way to step down risk in prolonged negative momentum without chasing short term noise.
• Testability. All parameters are visible in Inputs and the momentum series is plotted so users can verify every regime change in the Tester and on price history.
• Portable yardstick. The log return over a fixed window is a unit that can be applied to any liquid symbol with daily data.
Method overview in plain language
The method looks at how far the benchmark symbol has moved in log return terms over an eighteen month window in our example. If that long horizon return is positive the strategy allows a long stance on the traded symbol. If it is negative and shorts are enabled the strategy can flip short, otherwise it goes flat. There is an optional realised volatility estimate on the traded symbol that can scale position size toward a target annual volatility, but in the default configuration the model uses unit leverage and only the sign of momentum matters.
Base measures
Return basis. The core yardstick is the natural log of close divided by the close eighteen months ago on the benchmark symbol. Daily log returns of the traded symbol feed the realised volatility estimate when volatility targeting is enabled.
Components
• Component one Momentum eighteen months. Log of benchmark close divided by its close mom_lookback bars ago. Its sign defines the trend regime. No extra smoothing is applied beyond the long window itself.
• Component two Realised volatility optional. Standard deviation of daily log returns on the traded symbol over sixty three days. Annualised by the square root of 252. Used only when volatility targeting is enabled.
• Optional component Volatility targeting. Converts target annual volatility and realised volatility into a leverage factor clipped by a maximum leverage setting.
Fusion rule
The model uses a simple gate. First compute the sign of eighteen month log momentum on the benchmark symbol. Optionally compute leverage from volatility. The sign decides whether the strategy wants to be long, short, or flat. Leverage only rescales position size when enabled and does not change direction.
Signal rule
• Long suggestion. When eighteen month log momentum on the benchmark symbol is greater than zero, the strategy wants to be long.
• Short suggestion. When that log momentum is less than zero and shorts are allowed, the strategy wants to be short. If shorts are disabled it stays flat instead.
• Wait state. When the log momentum is exactly zero or history is not long enough the strategy stays flat.
• In position. In practice the strategy sits IN LONG while the sign stays positive and flips to IN SHORT or flat only when the sign changes.
Inputs with guidance
Setup
• Momentum Lookback (months). Controls the horizon of the log return on the benchmark symbol. Typical range 6 to 24 months. Raising it makes the model slower and more selective. Lowering it makes it more reactive and sensitive to medium term noise.
• Symbol. External symbol used for the momentum calculation, SPY by default. Changing it lets you time other indices or run signals from a benchmark while trading a correlated instrument.
Logic
• Allow Shorts. When true the strategy will open short positions during negative momentum regimes. When false it will stay flat whenever momentum is negative. Practical setting is tied to whether you use a margin account or an ETF that supports shorting.
Internal risk parameters (not exposed as inputs in this version) are:
• Target Vol (annual). Target annual volatility for volatility targeting, default 0.2.
• Vol Lookback (days). Window for realised volatility, default 63 trading days.
• Max Leverage. Cap on leverage when volatility targeting is enabled, default 2.
Usage recipes
Swing continuation
• Signal timeframe. Use the daily chart.
• Benchmark symbol. Leave at SPY for US equity index exposure.
• Momentum lookback. Eighteen months as a default, with twelve months as an alternative preset for a faster swing bias.
Properties visible in this publication
• Initial capital. 100000
• Base currency. USD
• Default order size method. 5% of the total capital in this example
• Pyramiding. 0
• Commission. 0.03 percent
• Slippage. 3 ticks
• Process orders on close. On
• Bar magnifier. Off
• Recalculate after order is filled. Off
• Calc on every tick. Off
• All request.security calls use lookahead = barmerge.lookahead_off
Realism and responsible publication
The strategy is for education and research only. It does not claim any guaranteed edge or future performance. All results in Strategy Tester are hypothetical and depend on the data vendor, costs, and slippage assumptions. Intrabar motion is not modeled inside daily bars so extreme moves and gaps can lead to fills that differ from live trading. The logic is built for standard candles and should not be used on synthetic chart types for execution decisions.
Performance is sensitive to regime structure in the US equity market, which may change over time. The strategy does not protect against single day crash risk inside bars and does not model gap risk explicitly. Past behavior of SPY and the momentum effect does not guarantee future persistence.
Honest limitations and failure modes
• Long sideways regimes with small net change over eighteen months can lead to whipsaw around the zero line.
• Very sharp V shaped reversals after deep declines will often be missed because the model waits for momentum to turn positive again.
• The sample size in a full SPY history is small because regime changes are infrequent, so any test must be interpreted as indicative rather than statistically precise.
• The model is highly dependent on the chosen lookback. Users should test nearby values and validate that behavior is qualitatively stable.
Legal
Education and research only. Not investment advice. You are responsible for your own decisions. Always test on historical data and in simulation with realistic costs before any live use.

NS ND - EVR - Daily Bias - TRFxVolume & Price Action Signals
What It Does
Combines three proven trading methodologies: Effort vs Result (EVR), No Supply/No Demand (NS/ND), and Daily Bias tracking for intraday traders.
Features
Effort vs Result (EVR)
- **Bullish**: Green triangle below bar when price sweeps previous low with high volume and significant wick
- **Bearish**: Red triangle above bar when price sweeps previous high with high volume and significant wick
- Identifies potential reversals where volume doesn't match price movement
No Supply / No Demand (NS/ND)
- **No Demand (Red dot)**: Up-candle with declining volume - buyers weakening
- **No Supply (Green dot)**: Down-candle with declining volume - sellers weakening
- Grey dots = unconfirmed, colored dots = confirmed within lookahead period
- Based on Volume Spread Analysis (VSA) principles
Daily Bias Label
Top-right corner shows market direction:
- **BULLISH ↑** - Closed above Previous Day High
- **BEARISH ↓** - Closed below Previous Day Low
- **BULLISH/BEARISH REV** - Swept level but closed back inside
- **RANGE ↔** - Trading between PDH/PDL
## Settings
- **EVR**: Toggle on/off, volume multiplier, wick %, inside bars, transparency
- **NS/ND**: Toggle on/off, lookahead bars (default: 10)
- **Daily Bias**: Toggle label display
## Best For
✓ Intraday trading (1m-1h timeframes)
✓ Reversal setups
✓ Volume analysis
✓ Confluence trading (all signals align)
How to Use
1. Enable components you want (all can be toggled independently)
2. Trade EVR signals in direction of Daily Bias
3. Look for NS/ND confirmation at key levels
4. Wait for colored dots (confirmed signals) over grey (unconfirmed)
**Note**: Works on intraday timeframes only. NS/ND signals may repaint during confirmation period.

ZScoreAnalysisLibrary "ZScoreAnalysis"
Z-score analysis for detecting statistical deviations and excess market behavior
calculate_zscore(source, lookback, threshold, switch_enabled)
Calculate Z-score and related metrics with history tracking
Parameters:
source (float) : Data source for Z-score calculation
lookback (int) : Lookback period for mean and standard deviation
threshold (float) : Z-score threshold for significance
switch_enabled (string) : Enable/disable switch ("Enabled"/"Disabled")
Returns: Z-score, historical significant values, and running average
get_zscore_threshold(opt, input_thr, avg)
Get threshold based on threshold option
Parameters:
opt (string) : Threshold option ("User Input Threshold", "Average as Threshold", or other)
input_thr (float) : User input threshold
avg (float) : Average threshold
Returns: Calculated threshold value
is_zscore_filtered(switch_enabled, zscore, threshold)
Check if a metric passes the Z-score filter
Parameters:
switch_enabled (string) : Enable/disable switch
zscore (float) : Current Z-score value
threshold (float) : Z-score threshold
Returns: True if filtered (exceeds threshold)
get_consecutive_distances(body_dir, breakout_dir, is_inside_bar)
Calculate consecutive distances for Z-score analysis
Parameters:
body_dir (int) : Body direction
breakout_dir (int) : Breakout direction
is_inside_bar (bool) : Inside bar flag
Returns:
get_trend_to_mean_distance()
Calculate distance from trend to mean for momentum analysis
Returns: Distance between trend and mean
get_all_zscores(lookback, threshold, bar_dist_switch, body_dist_switch, chl_dist_switch, cc_dist_switch, m_dist_switch, body_dir, breakout_dir, is_inside_bar)
Get all Z-score calculations for the indicator
Parameters:
lookback (int) : Z-score lookback period
threshold (float) : Z-score threshold
bar_dist_switch (string) : Enable bar distance Z-score
body_dist_switch (string) : Enable body distance Z-score
chl_dist_switch (string) : Enable consecutive highs/lows Z-score
cc_dist_switch (string) : Enable consecutive closes Z-score
m_dist_switch (string) : Enable momentum distance Z-score
body_dir (int) : Body direction
breakout_dir (int) : Breakout direction
is_inside_bar (bool) : Inside bar flag
Returns: Array of Z-score results and filters
get_combined_zscore_filters(z_filters)
Get combined Z-score filters
Parameters:
z_filters (map) : Map of individual Z-score filters
Returns: Various combinations of Z-score filters
get_basic_distances()
Calculate basic distances used in Z-score analysis
Returns: Bar range and body range
get_individual_zscore_filter(z_filters, filter_name)
Get individual Z-score filter by name
Parameters:
z_filters (map) : Map of Z-score filters
filter_name (string) : Name of the filter ("bar_dist", "body_dist", etc.)
Returns: Boolean filter result
has_any_zscore_signal(z_filters)
Check if any Z-score filter is active
Parameters:
z_filters (map) : Map of individual Z-score filters
Returns: True if any Z-score exceeds threshold

3-1 Setup Detector (Multi-Timeframe)📌 3-1 Setup Detector (Multi-Timeframe) – Description
The 3-1 Setup Detector (Multi-Timeframe) is a powerful price action indicator designed for The Strat trading method. It automatically detects 3-1 setups, where an outside bar (3) is followed by an inside bar (1), signaling potential breakout opportunities.
🔥 Key Features:
✅ Multi-Timeframe Support – Works on 1H, 2H, 3H, 4H, 6H, 12H, Daily, 2D, 3D, Weekly, 2W, 3W, Monthly, Quarterly
✅ Real-Time Alerts – Get notified when a 3-1 setup forms
✅ Easy Visualization – Plots markers on the chart for quick recognition
✅ Customizable Timeframe – Select a specific higher timeframe for confirmation
📊 How It Works:
Identifies an outside bar (3), where the high is higher and the low is lower than the previous bar.
Detects an inside bar (1), where the high is lower and the low is higher than the previous bar.
If a 3-1 sequence occurs, the indicator marks the setup on the chart and triggers an alert.
🎯 Trading Applications:
Breakout Strategy: Trade breakouts when the 3-1 setup forms near key levels.
Reversal Signals: Use in combination with support/resistance for confirmation.
Multi-Timeframe Analysis: Detect setups on higher timeframes while trading lower ones.
🚀 Perfect for traders who use The Strat method and want real-time, high-probability trade setups across multiple timeframes!

AbdulLibraryLibrary "AbdulLibrary"
The library consists of three sections:
Technical Analysis Functions - A collection of tools commonly used by day traders
Trading Setup Filters Functions - A number of filters that help day traders to screen trading signals
Candlestick Pattern Detection Functions - To detect different candlestick patterns that are used in day trading setups
Note that this would have been possible without the help of @ZenAndTheArtOfTrading as I build-up this library after completing his pine script mastery course so big thanks to him
The content of the library are:-
fibLevels(preDayClose, preDayHigh, preDayLow) Calculates Daily Pivot Point and Fibonacci Key Levels
Parameters:
preDayClose : The previous day candle close
preDayHigh : The previous day candle high
preDayLow : The previous day candle low
Returns: Returns Daily Pivot Point and Fibonacci Key Levels as a tuple
bullishFib(canHigh, canLow, fibLevel) Calculates Fibonacci Levels in Bullish move
Parameters:
canHigh : The high of the move
canLow : The low of the move
fibLevel : The Fib level as % you want to calculate
Returns: Returns The Fib level for the Bullish move
bearishFib(canHigh, canLow, fibLevel) Calculates Fibonacci Levels in Bearish move
Parameters:
canHigh : The high of the move
canLow : The low of the move
fibLevel : The Fib level as % you want to calculate
Returns: Returns The Fib level for the Bearish move
getCandleSize() Calculates the size of candle (high - low) in points
Returns: Returns candle size in points
getCandleBodySize() Calculates the size of candle (close - open) in points
Returns: Returns candle body size in points
getHighWickSize() Calculates the high wick size of candle in points
Returns: Returns The high wick size of candle in points
getLowWickSize() Calculates the low wick size of candle in points
Returns: Returns The low wick size of candle in points
getBodyPercentage() Calculates the candle body size as % of overall candle size
Returns: Returns The candle body size as % of overall candle size
isSwingHigh(period) Checks if the price has created new swing high over a period of time
Parameters:
period : The lookback time we want to check for swing high
Returns: Returns True if the current candle or the previous candle is a swing high
isSwingLow(period) Checks if the price has created new swing low over a period of time
Parameters:
period : The lookback time we want to check for swing low
Returns: Returns True if the current candle or the previous candle is a swing low
isDojiSwingHigh(period) Checks if a doji is a swing high over a period of time
Parameters:
period : The lookback time we want to check for swing high
Returns: Returns True if the doji is a swing high
isDojiSwingLow(period) Checks if a doji is a swing low over a period of time
Parameters:
period : The lookback time we want to check for swing low
Returns: Returns True if the doji is a swing low
isBigBody(atrFilter, atr, candleBodySize, multiplier) Checks if a candle has big body compared to ATR
Parameters:
atrFilter : Check if user wants to use ATR to filter candle-setup signals
atr : The ATR value to be used to compare candle body size
candleBodySize : The candle body size
multiplier : The multiplier to be used to compare candle body size
Returns: Returns Boolean true if the candle setup is big
isSmallBody(atrFilter, atr, candleBodySize, multiplier) Checks if a candle has small body compared to ATR
Parameters:
atrFilter : Check if user wants to use ATR to filter candle-setup signals
atr : The ATR value to be used to compare candle body size
candleBodySize : The candle body size
multiplier : The multiplier to be used to compare candle body size
Returns: Returns Boolean true if the candle setup is small
isHammer(fibLevel, colorMatch) Checks if a candle is a hammer based on user input parameters and candle conditions
Parameters:
fibLevel : Fib level to base candle body on
colorMatch : Checks if user needs for the candel to be green
Returns: Returns Boolean - True if the candle setup is hammer
isShootingStar(fibLevel, colorMatch) Checks if a candle is a shooting star based on user input parameters and candle conditions
Parameters:
fibLevel : Fib level to base candle body on
colorMatch : Checks if user needs for the candel to be red
Returns: Returns Boolean - True if the candle setup is star
isBullEngCan(allowance, period) Check if a candle is a bullish engulfing candle
Parameters:
allowance : How many points the candle open is allowed to be off (To allow for gaps)
period : The lookback period for swing low check
Returns: Boolean - True only if the candle is a bullish engulfing candle
isBearEngCan(allowance, period) Check if a candle is a bearish engulfing candle
Parameters:
allowance : How many points the candle open is allowed to be off (To allow for gaps)
period : The lookback period for swing high check
Returns: Boolean - True only if the candle is a bearish engulfing candle
isBullDoji(maxSize, wickLimit, colorFilter) Check if a candle is a bullish doji candle
Parameters:
maxSize : Maximum candle body size as % of total candle size to be considered as doji
wickLimit : Maximum wick size of one wick compared to the other wick
colorFilter : Checks if the doji is green
Returns: Boolean - True if the candle is a bullish doji
isBearDoji(maxSize, wickLimit, colorFilter) Check if a candle is a bearish doji candle
Parameters:
maxSize : Maximum candle body size as % of total candle size to be considered as doji
wickLimit : Maximum wick size of one wick compared to the other wick
colorFilter : Checks if the doji is red
Returns: Boolean - True if the candle is a bearish doji
isBullOutBar() Check if a candle is a bullish outside bar
Returns: Boolean - True if the candle is a bullish outside bar
isInsideBar() Check if a candle is an inside bar
Returns: Returns Boolean - True if a candle is an inside bar

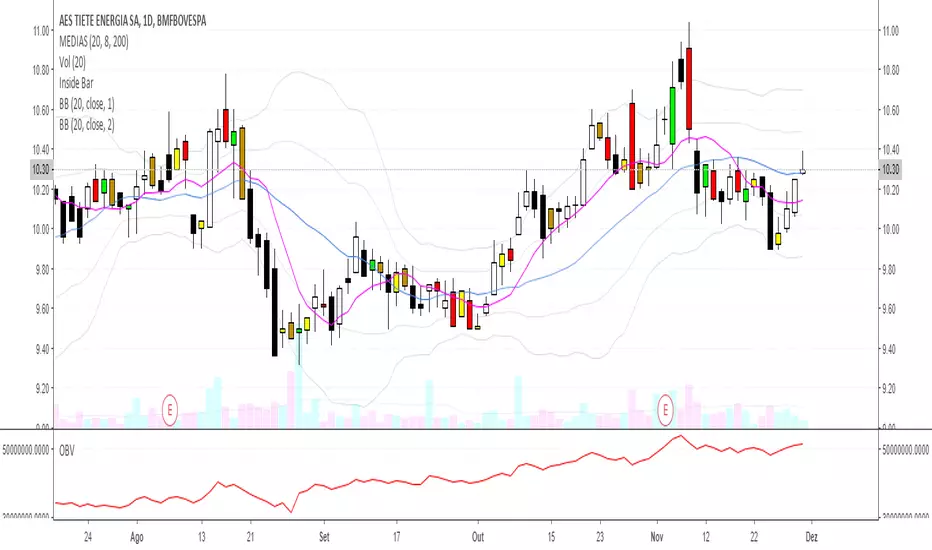
DCA Percent SignalOverview
The DCA Percent Signal Indicator generates buy and sell signals based on percentage drops from all-time highs and percentage gains from lowest lows since ATH. This indicator is designed for pyramiding strategies where each signal represents a configurable percentage of equity allocation.
Definitions
DCA (Dollar-Cost Averaging): An investment strategy where you invest a fixed amount at regular intervals, regardless of price fluctuations. This indicator generates signals for a DCA-style pyramiding approach.
Gann Bar Types: Classification system for price bars based on their relationship to the previous bar:
Up Bar: High > previous high AND low ≥ previous low
Down Bar: High ≤ previous high AND low < previous low
Inside Bar: High ≤ previous high AND low ≥ previous low
Outside Bar: High > previous high AND low < previous low
ATH (All-Time High): The highest price level reached during the entire chart period
ATL (All-Time Low): The lowest price level reached since the most recent ATH
Pyramiding: A trading strategy that adds to positions on favorable price movements
Look-Ahead Bias: Using future information that wouldn't be available in real-time trading
Default Properties
Signal Thresholds:
Buy Threshold: 10% (triggers every 10% drop from ATH)
Sell Threshold: 30% (triggers every 30% gain from lowest low since ATH)
Price Sources:
ATH Tracking: High (ATH detection)
ATL Tracking: Low (low detection)
Buy Signal Source: Low (buy signals)
Sell Signal Source: High (sell signals)
Filter Options:
Apply Gann Filter: False (disabled by default)
Buy Sets ATL: False (disabled by default)
Display Options:
Show Buy/Sell Signals: True
Show Reference Lines: True
Show Info Table: False
Show Bar Type: False
How It Works
Buy Signals: Trigger every 10% drop from the all-time highest price reached
Sell Signals: Trigger every 30% increase from the lowest low since the most recent all-time high
Smart Tracking: Uses configurable price sources for signal generation
Key Features
Configurable Thresholds: Adjustable buy/sell percentage thresholds (default: 10%/30%)
Separate Price Sources: Independent sources for ATH tracking, ATL tracking, and signal triggers
Configurable Signals: Uses low for buy signals and high for sell signals by default
Optional Gann Filter: Apply Gann bar analysis for additional signal filtering
Optional Buy Sets ATL: Option to set ATL reference point when buy signals occur
Visual Debug: Detailed labels showing signal parameters and values
Usage Instructions
Apply to Chart: Use on any timeframe (recommended: 1D or higher for better signal quality)
Risk Management: Adjust thresholds based on your risk tolerance and market volatility
Signal Analysis: Monitor debug labels for detailed signal information and validation
Signal Logic
Buy signals are blocked when ATH increases to prevent buying at peaks
Sell signals are blocked when ATL decreases to prevent selling at lows
This ensures signals only trigger on subsequent bars, not the same bar that establishes new reference points
Buy Signals:
Calculate drop percentage from ATH to buy signal source
Trigger when drop reaches threshold increments (10%, 20%, 30%, etc.)
Always blocked on ATH bars to prevent buying at peaks
Optional: Also blocked on up/outside bars when Gann filter enabled
Sell Signals:
Calculate gain percentage from lowest low to sell signal source
Trigger when gain reaches threshold increments (30%, 60%, 90%, etc.)
Always blocked when ATL decreases to prevent selling at lows
Optional: Also blocked on down bars when Gann filter enabled
Limitations
Designed for trending markets; may generate many signals in sideways/ranging markets
Requires sufficient price movement to be effective
Not suitable for scalping or very short timeframes
Implementation Notes
Signals use optimistic price sources (low for buys, high for sells), these can be configured to be more conservative
Gann filter provides additional signal filtering based on bar types
Debug information available in data window for real-time analysis
Detailed labels on each signal show ATH, lowest low, buy level, sell level, and drop/gain percentages

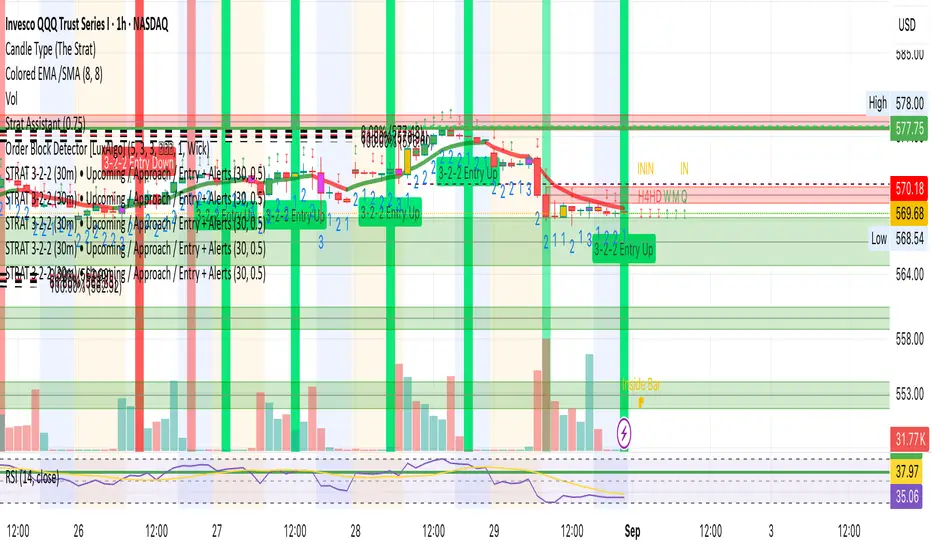
STRAT 3-2-2 (30m) • Upcoming / Approach / Entry + AlertsThis indicator is built for The STRAT trading method, specifically the 3-2-2 reversal pattern. It monitors price action on the 30-minute timeframe (HTF = 30m) and visually/alert-wise highlights where a 3-2-2 setup, approach, or entry trigger occurs.
---
⚙️ How it works
1. Detects bar types:
3 (Outside Bar) = range breaks both high & low of the previous bar
2u (Up bar) = higher high, not outside
2d (Down bar) = lower low, not outside
1 (Inside bar) = fully contained within prior bar
2. Looks for 3-2-2 setups:
Bullish 3-2-2 = 3 → 2d → 2u (expect reversal UP)
Bearish 3-2-2 = 3 → 2u → 2d (expect reversal DOWN)
3. Defines trigger levels:
Bullish trigger = high of the first “2d” bar
Bearish trigger = low of the first “2u” bar
4. Signals 3 phases:
Upcoming: pattern is forming, second “2” hasn’t triggered yet
Approach: price comes within 50% (adjustable) of the trigger level
Entry: price breaks the trigger (actual reversal confirmation)
5. Visualization:
Labels above/below candles show “Approach” and “Entry”
Background or bar colors (toggle in settings) highlight Setup / Approach / Entry
Optional dotted line marks the trigger level for clarity
---
🔔 Alerts
Two alert systems are built in:
1. Safe static conditions (for normal TradingView alert setup):
APPROACH: Bullish 3-2-2 (30m)
APPROACH: Bearish 3-2-2 (30m)
ENTRY: Bullish 3-2-2 (30m)
ENTRY: Bearish 3-2-2 (30m)
2. Dynamic messages (using alert() calls with price info):
If you create an alert with “Any alert() function call”, the pop-up will include the trigger price.
---
📋 Inputs (Settings)
Signal timeframe (HTF) → default 30m
Confirm signals at HTF bar close → waits for bar close (non-repainting)
Approach = % of first '2' bar range → default 50%
Show labels → On/Off
Color candles instead of background → toggle between candle color vs. chart background
Brooks Always In [KintsugiTrading]Brooks Always In
Overview:
The "Brooks Always In Indicator" by KintsugiTrading is a tool designed for traders who follow price action methodologies inspired by Al Brooks. This indicator identifies key bar patterns and breakouts, plots an Exponential Moving Average (EMA), and highlights consecutive bullish and bearish bars. It is intended to assist traders in making informed decisions based on price action dynamics.
Features:
Consecutive Bar Patterns:
Identifies and highlights consecutive bullish and bearish bars.
Differentiates between bars that are above/below the EMA and those that are not.
Customizable EMA:
Option to display an Exponential Moving Average (EMA) with user-defined length and offset.
The EMA can be smoothed using various methods such as SMA, EMA, SMMA (RMA), WMA, and VWMA.
Breakout Patterns:
Recognizes bullish and bearish breakout bars and outside bars.
Tracks inside bars and prior bar conditions to better understand the market context.
Customizable Display:
Users can display or hide the EMA, consecutive bar patterns, and consecutive bars relative to the moving average.
How to Use:
Customize Settings:
First, I like to navigate to the top right corner of the chart (bolt icon), and change both the bull and bear body color to match the background (white/black) - this helps the user visualize the indicator far better.
Next, Toggle to display EMA, consecutive bar patterns, and consecutive bars relative to the moving average using the provided input options.
Adjust the EMA length, source, and offset as per your trading strategy.
Select the smoothing method and length for the EMA if desired.
Analyze Key Patterns:
Observe the highlighted bars on the chart to identify consecutive bullish and bearish patterns.
Use the plotted EMA to gauge the general trend and analyze the relationship between price bars and the moving average.
Informed Decision Making:
Utilize the identified bar patterns and breakouts to make informed trading decisions, such as identifying potential entry and exit points based on price action dynamics.
Good luck with your trading!

WillStop Pro [tradeviZion]WillStop Pro : A Step-by-Step Guide for Beginners to Master Trend Trading
Welcome to an in-depth guide to the WillStop Pro indicator. This article will walk you through the key features, how to use them effectively, and how this tool can help you navigate the markets confidently. WillStop Pro is based on principles established by Larry Williams, a well-known figure in trading, and aims to help you manage trades more effectively without overcomplicating things.
This guide will help you understand the basics of the WillStop Pro indicator, how to interpret its signals, and how to use it step-by-step to manage risk and identify opportunities in your trading journey. We will also cover the underlying logic and calculations for advanced users interested in more details.
What is the WillStop Pro Indicator?
The WillStop Pro indicator is a user-friendly tool that helps traders establish stop levels dynamically. It helps you figure out optimal points to enter or exit trades, while managing risk effectively during changing market conditions. The indicator tracks trending markets and sets price levels as stops for ongoing trades, making it suitable both for deciding when to enter and exit trades.
The indicator is beginner-friendly because it simplifies complex calculations and presents the results visually. This allows traders to focus more on their decision-making process instead of spending time with complex analysis.
WillStop Pro adapts to different market conditions, whether you're trading stocks, forex, commodities, or cryptocurrencies. It adjusts stop levels dynamically based on current market momentum, providing a practical way to manage both risk and reward.
Another significant benefit of WillStop Pro is that it works well with other indicators. Beginners can use it on its own or combine it with other tools like moving averages or oscillators to form a comprehensive trading strategy. Whether you are trading daily or looking at longer-term trends, WillStop Pro helps you manage your trades effectively.
Key Features of WillStop Pro
Dynamic Stop Levels : WillStop Pro calculates real-time stop levels for both long (buy) and short (sell) positions. This helps you protect your profits and reduce risk. The stop levels adjust based on the current market environment, making them more adaptable compared to fixed stop levels.
Advanced Stop Settings : There are optional settings to make the stop calculations more advanced, which take into consideration previous price movements to refine where the stops should be placed. These settings provide more precise control over your trades.
Break Signals and Alerts : The indicator provides visual signals, like arrows, to show when a stop level has been broken. This makes it easier for you to identify possible reversals and understand when the market direction is changing.
Comprehensive Table Display : A small table on the chart shows the current trend, the stop level, and whether advanced mode is active. This simple display provides an overview of the market, making decision-making easier.
Based on Larry Williams' Methodology : WillStop Pro builds upon Larry Williams' ideas, which are designed to capture major market trends while managing risk effectively. It provides a systematic way to follow these strategies without requiring deep technical analysis skills.
How Are Stop Levels Calculated? (For Advanced Users)
The WillStop Pro indicator determines stop levels by evaluating highs, lows, and closing prices over a specific lookback period. It uses this information to identify key points that justify adjusting your stop level, and there are separate approaches for both long and short positions.
Below, we explain the mathematical logic behind the stop calculations, along with some code snippets to give advanced users a clearer understanding.
For Long Stops (buy positions): The indicator looks for the highest closing price within the lookback period and continues until it finds three valid bars that meet certain criteria. Stops are adjusted to skip bars that have consecutive upward closes to ensure that the stop is placed at a level that offers solid support. Specifically, the function iterates over recent bars to determine the highest closing value, and checks for specific conditions before finalizing the stop level. Here is an excerpt of the relevant code:
getTrueLow(idx) => math.min(low , close )
findStopLevels() =>
float highestClose = close
int highestCloseIndex = 0
for i = 0 to lookback
if close > highestClose
highestClose := close
highestCloseIndex := i
// Logic to adjust based on up close skipping
int longCount = 0
int longCurrentIndex = highestCloseIndex
while longCount < 3 and longCurrentIndex < 100
if not isInsideBar(longCurrentIndex)
longCount += 1
longCurrentIndex += 1
// Determine the lowest low for the stop level
float longStopLevel = high * 2
for i = searchIndex to highestCloseIndex
longStopLevel := math.min(longStopLevel, getTrueLow(i))
// Apply offset
longStopLevel := longStopLevel - (offsetTicks * tickSize)
In this code snippet, the function findStopLevels() calculates the long stop level by first identifying the highest close within the lookback period and then finding a suitable support level while skipping certain conditions, such as inside bars or consecutive upward closes. Finally, the user-defined offset ( offsetTicks ) is applied to determine the stop level.
For Short Stops (sell positions): Similarly, the indicator finds the lowest closing price within the lookback period and then identifies three bars that fit the conditions for a short stop. It avoids using bars with consecutive down closes to help find a more robust resistance level. Here's a relevant code snippet:
getTrueHigh(idx) => math.max(high , close )
findStopLevels() =>
float lowestClose = close
int lowestCloseIndex = 0
for i = 0 to lookback
if close < lowestClose
lowestClose := close
lowestCloseIndex := i
// Logic to adjust based on down close skipping
int shortCount = 0
int shortCurrentIndex = lowestCloseIndex
while shortCount < 3 and shortCurrentIndex < 100
if not isInsideBar(shortCurrentIndex)
shortCount += 1
shortCurrentIndex += 1
// Determine the highest high for the stop level
float shortStopLevel = 0
for i = searchIndex to lowestCloseIndex
shortStopLevel := math.max(shortStopLevel, getTrueHigh(i))
// Apply offset
shortStopLevel := shortStopLevel + (offsetTicks * tickSize)
Here, findStopLevels() calculates the short stop level by finding the lowest closing price within the lookback period. It then determines the highest value that acts as a resistance level, excluding bars that do not fit certain criteria.
Volume Confirmation for Alert Accuracy : To further enhance the stop level accuracy, volume is used as a confirmation filter. The average volume (volAvg) is calculated over a 20-period moving average, and alerts are only generated if the volume exceeds a defined threshold (volMultiplier). This ensures that price movements are significant enough to consider as meaningful signals.
volAvg = ta.sma(volume, 20)
isVolumeConfirmed() =>
result = requireVolumeConfirmation ? volume > (volAvg * volMultiplier) : true
result
This additional logic ensures that stop level breaks or adjustments are not triggered during periods of low trading activity, thus enhancing the reliability of the generated signals.
These calculations are at the core of WillStop Pro's ability to determine dynamic stop levels that respond effectively to market movements, helping traders manage risk by placing stops at levels that make sense given historical price and volume data.
How to Identify Opportunities with WillStop Pro
WillStop Pro provides various signals that help you decide when to enter or exit a trade:
When a Stop Level is Broken: If a stop level (support for long positions or resistance for short positions) is broken, it may indicate a reversal. WillStop Pro visually plots arrows whenever a stop level is breached, making it easy for you to see where changes might occur. This feature helps traders identify momentum shifts quickly.
Support and Resistance Levels: The indicator plots support and resistance levels, which show key zones to watch for opportunities. These levels often act as psychological barriers in the market, where price action may either reverse or stall temporarily.
Dynamic State Management: The indicator shifts between long and short states based on price action, providing real-time feedback. This helps traders stick to their trading plan without second-guessing the market.
A major advantage of WillStop Pro is that it responds well to changing market conditions. By identifying when key support or resistance levels break, it allows you to adjust your strategies and react to new opportunities accordingly. Whether the market is trending strongly or staying within a range, WillStop Pro provides valuable information to help guide your trades.
Setting Up Alerts
Alerts are an important feature in trading, especially when you can’t be in front of your charts all the time. WillStop Pro has been enhanced to include flexible alert settings to help you stay on top of your trades without constantly monitoring the charts.
Enable Alerts: There is a master switch to enable or disable all alerts. This way, you can control whether you want to be notified of events at any time.
Alert Frequency: Choose between receiving alerts Once Per Bar or Once Per Bar Close . This helps you manage the frequency of alerts and decide if you need real-time updates or want confirmation after a bar closes.
Break Alerts: These alerts notify you when a stop level has been broken. This can help you catch potential reversals or trading opportunities as soon as they happen.
Strong Break Alerts: Alerts are available for strong breaks, which occur when the price breaks stop levels with confirmation based on additional price, volume, and momentum criteria. These alerts help identify significant shifts in the market.
Level Change Alerts: These alerts tell you whenever a new stop level is calculated, keeping you updated about changes in market dynamics. You can set a Minimum Level Change % to ensure that alerts are only triggered when the stop level changes significantly.
Require Volume Confirmation: You can opt to receive alerts only if the volume is above a certain threshold. This confirmation helps reduce false signals by ensuring that significant price changes are backed by increased trading activity.
Volume Multiplier: The volume multiplier allows you to set a minimum volume requirement that must be met for an alert to trigger. This ensures that alerts are triggered only when there is sufficient trading interest.
Here is a part of the updated alert logic that has been implemented in the indicator:
// Alert on break conditions
if alertsEnabled
if alertOnBreaks
if longStopBroken and isVolumeConfirmed()
alert(createAlertMessage("Support Break - Short Signal", useAdvancedStops), alertFreq)
if shortStopBroken and isVolumeConfirmed()
alert(createAlertMessage("Resistance Break - Long Signal", useAdvancedStops), alertFreq)
// Strong break alerts
if alertOnStrongBreaks
if longStopBroken and isStrongBreak(false)
alert(createAlertMessage("Strong Support Break - Short Signal", useAdvancedStops), alertFreq)
if shortStopBroken and isStrongBreak(true)
alert(createAlertMessage("Strong Resistance Break - Long Signal", useAdvancedStops), alertFreq)
// Level change alerts
if alertOnLevelChanges and isSignificantChange() and isVolumeConfirmed()
alert(createAlertMessage("Significant Level Change", useAdvancedStops), alertFreq)
Setting alerts allows you to react to market changes without having to watch the charts constantly. Alerts are particularly helpful if you have other responsibilities and can’t be actively monitoring your trades all day.
Understanding the Table Display
The WillStop Pro indicator provides a status table that gives an overview of the current market state. Here’s what the table shows:
Indicator Status: The table indicates whether the indicator is in a LONG or SHORT state. This helps you quickly understand the market trend.
Stop Level: The active stop level is shown, whether it is acting as support (long) or resistance (short). This is important for knowing where to set your protective stops.
Mode: The table also displays whether the advanced calculation mode is being used. This keeps you informed about how stop levels are being calculated and why they are positioned where they are.
Empowering Messages: The table also includes motivational messages that rotate periodically, such as 'Trade with Clarity, Stop with Precision' and 'Let Winners Run, Cut Losses Short.' These messages are designed to keep you focused, motivated, and disciplined during your trading journey.
The table is simple and easy to follow, helping you maintain discipline in your trading plan. By having all the essential information in one place, the table reduces the need to make quick, emotional decisions and promotes more thoughtful analysis.
Tips for Using WillStop Pro Effectively
Here are some practical ways to make the most of the WillStop Pro indicator:
Start with Default Settings: If you’re new to the indicator, start with the default settings. This will give you an idea of how stop levels are determined and how they adjust to different markets.
Experiment with Advanced Settings: Once you are comfortable, try using the advanced stop settings to see how they refine the stop levels. This can be useful in certain market conditions to improve accuracy.
Use Alerts to Stay Updated: Set up alerts for when a stop level is broken or when new levels are calculated. This helps you take action without constantly watching the chart. Swing traders may find alerts especially helpful for monitoring longer-term moves.
Monitor the Status Table: Keep an eye on the status table to understand the current market condition. Whether the indicator is in a LONG or SHORT state can help you make more informed decisions.
Focus on Risk Management: WillStop Pro is designed to help you manage risk by dynamically adjusting stop levels. Make sure you are using these levels to protect your trades, especially during strong trends or volatile periods.
Acknowledging Larry Williams' Influence
WillStop Pro is inspired by the work of Larry Williams, who described the approach as one of his best trading techniques. His method aims to ride major market trends while reducing the risk of giving back gains during corrections. WillStop Pro builds upon this approach, adding features like advanced stop settings and visual alerts that make it easier to apply in modern markets.
By using WillStop Pro, you are essentially leveraging a well-established trading strategy with additional tools that help improve its effectiveness. The indicator is designed to provide a reliable way to manage trades, stay on top of market conditions, and reduce emotional decision-making.
Conclusion: Why WillStop Pro is Great for Beginners and Advanced Users
The WillStop Pro is a powerful yet easy-to-use tool that helps traders ride trends while managing risk during market corrections. It can be used both for entering and exiting trades, and its visual features make it accessible for those who are new to trading, while the underlying logic appeals to advanced users seeking greater control and understanding.
WillStop Pro is more than just a tool for setting stops. It is a comprehensive solution for managing trades, with features like dynamic stop levels, customizable alerts, and an easy-to-understand status table. This combination of simplicity and advanced features makes it suitable for beginners as well as more experienced traders.
We hope this guide helps you get started with WillStop Pro and improves your trading confidence. Remember to start with the basics, explore the advanced features, and set alerts to stay informed without getting overwhelmed. Whether you’re just beginning or want to simplify your strategy, WillStop Pro is a valuable tool to have in your trading arsenal.
Trading can be challenging, but the right tools make it more manageable. WillStop Pro helps you keep track of market movements, identify opportunities, and manage risk effectively. Give it a try and see how it can improve your trading decisions and help you navigate the markets more efficiently.
By incorporating WillStop Pro into your strategy, you are following a systematic approach that has been refined over time. It’s designed to help you make sense of the markets, plan your trades, and manage your risks with greater clarity and confidence.
Note: Always practice proper risk management and thoroughly test the indicator to ensure it aligns with your trading strategy. Past performance is not indicative of future results.
Trade smarter with TradeVizion—unlock your trading potential today!

Price Action All In OneThis indicator represents the most advanced level of price action indicators, incorporating six useful features: traditional gaps, shadow gaps, bar counting, moving averages, previous values, and IO pattern matching .
When I refer to price action, I mean the teachings of Dr. Al Brooks.
While you can find these features in other indicators, mine is more advanced. The default settings are designed to work on a 5-minute timeframe, but you can also use this indicator on other time periods if you prefer.
Gaps
Traditional Gaps: Occurs when the lowest price of a bar is higher than the highest price of the previous bar, or the highest price of a bar is lower than the lowest price of the previous bar.
Shadow/Tail Gaps: Occurs when the lowest price of a bar is higher than the highest price of the second last bar, or the highest price of a bar is lower than the lowest price of the second last bar.
Gaps indicate strength, and consecutive gaps in one direction are characteristic of a strong trend. They offer a perspective on the strength of a trend, signifying that limit orders on one side are at a loss with no opportunity to exit at breakeven. Can bulls or bears create gaps? Are the gaps they create filled, or do they remain open?
Traditional Gaps & Shadow/Tail Gaps
Bar Counting
The ability to use different timeframes (e.g., to determine the minute within an hour or the hour within a week).
Consistent display of 1; in other indicators, if you set intervals to 2, you see 2, 4, 6, etc., or 1, 2, 4, 6. In my indicator, you will see 1, 3, 5, etc.
In intraday trading, certain specific times are more important than others. For example, a form of reversal is more likely to occur at the midpoint of the trading day (if there are 80 candles in a day, the midpoint is at the 40th candle).
This doesn't mean you should make reversal trades at the 40th candle. The bar count feature simply reminds you of the current time, helping you gauge how long until the trading day ends. For instance, if there are 80 candles in a day and you're an intraday trader, you probably shouldn't make a swing trade at the 70th candle because there are only 10 candles left until the close—likely not enough time for a swing to develop.
Additionally, if you trade on a 5-minute timeframe, seeing candles numbered 3, 6, 9, etc. indicates the close of a 15-minute candle. This means that in addition to 5-minute timeframe traders, 15-minute timeframe traders will also pay attention to these candles, making them more significant. For the same reason, the 12th candle is crucial, as its close also marks the close of an hourly candle.
Day Time Frame & Week Time Frame
Moving Averages
Provides three EMAs. You can set different timeframes and choose between continuous or discrete modes.
Moving averages are excellent tools for determining trends. The 20 EMA is particularly popular, which increases its significance. Traders using different timeframes, such as 5-minute, 15-minute, and 1-hour, all utilize the 20 EMA. This indicator allows you to see what traders on 15-minute and 1-hour timeframes are observing, even when you're on a 5-minute timeframe.
Once again, the default settings of this indicator assume that the user is trading intraday on a 5-minute timeframe. However, if that's not the case, you can easily adjust the moving average periods. For instance, if you trade on a 1-hour timeframe and want to display the 4-hour and daily moving averages on your chart, this can be done effortlessly.
5m 20, 15m 20 & 1h 20
Previous Values
Features three previous value displays. You can set their sources and timeframes independently and define the range for all previous values.
For intraday trading, marking the previous day's high, low, and close prices can be crucial. While some other indicators provide this feature, mine does it better. You can set different timeframes and choose various sources. For example, you might want to display the average of (O+H+L+C)/4 for the last week.
In addition to setting the timeframe and source, you can also configure the display range:
All: This will show the data in all positions. For example, you can see the high price from two days ago on yesterday's chart.
Today: This will only display the previous day's high price on the current day's chart.
Timeframe: This will display the data based on the specified timeframe you set.
Last Week High, Last Day Close & Low(Timeframe Display)
IO Pattern Matching
More advanced than other IO pattern matching indicators. For adjacent IIs, it merges to display as III, IIII, and so on. The same applies to OO patterns. Additionally, it automatically merges adjacent IOI and II into IOII, and adjacent OO and IOI into IIOI.
II Pattern: This refers to two consecutive inside bar candles. On a lower timeframe, the II pattern forms a converging triangle, which is a breakout pattern. The II pattern could also potentially become a final flag, which is the last flag in a trend.
OO Pattern: This refers to two consecutive outside bar candles. On a lower timeframe, the OO pattern forms an expanding triangle. You can use the OO pattern similarly to how you would use an expanding triangle.
IOI Pattern: This pattern occurs when the first candle is contained within the second candle, and the third candle is also contained within the second candle. This is a breakout pattern and could similarly represent a terminal flag in a trend.
The appearance of II, OO, or IOI patterns does not necessarily mean you should make a reversal trade. These patterns are meant to mark potential moves in a lower timeframe within the current cycle, providing a new perspective on the market and reminding you to stay vigilant.
You shouldn't look for IO patterns in a tight trading range. There are many IO patterns in a tight trading range, but they don't hold much significance.
II, OO & IOI

Bar colour BreakoutIndicator that changes the colour of the bars depending on the breakout of the high or the low of the previous bar. A lime bar indicates a bar that has a higher high than the previous one. A fuchsia bar indicates a bar that has a lower low than the previous bar. A yellow bar indicates an outside bar (higher high and lower low than the previous one). A blue bar indicates an inside bar (lower high and higher low).

Cnagda Liquidit Trading SystemCnagda Liquidit Trading System helps spot where price is likely to trap traders and reverse, then gives simple, actionable Level to entry, place SL, and take profits with confidence. It blends imbalance zones, trend bias, order blocks, liquidity pools, high-probability fake Signal, and context-aware candle patterns into one clean workflow.
🟩🟥 Imbalance boxes: “Crowd rushed, gaps left”
What it is: Green/red boxes mark fast, one-sided moves where price “skipped” orders—think FVG-like zones that often get revisited.
Why it helps: Price frequently pulls back to “fill” these zones, creating clean retest entries with logical stops.
⏩How to use:
Green box = potential demand retest; Red box = potential supply retest. Enter on pullback into box, not on first impulse. Put stop on far side of box and aim first targets at recent swing points.
↕️ Swing bias (HH/HL vs LH/LL): “Which way is the road?”
What it is: Higher-highs/higher-lows = up-bias; Lower-highs/lower-lows = down-bias. system plots Buy/Sell OB levels aligned with that bias.
Why it helps: Trading with the broader flow reduces “hero trades” against institutions. Bias gives clearer entries and cleaner drawdowns.
⏩How to use:
Up-bias: look for long on Buy OB retests. Down-bias: look for short on Sell OB retests. Wait for a small rejection/engulfing to confirm before triggering.
🧱Order blocks: “Where big players remember”
What it is: last opposite-colored candle before an impulsive move—these zones often hold memory and reaction. system plots these as Buy/Sell OB lines.
Why it helps: Many breakouts pull back to the origin. Good entries often happen on retest, not on the breakout chase.
⏩ How to use:
Let price return into the OB, show wick rejection, and decent volume. Enter with stop beyond OB; define risk-reward before entry.
📊Volume coloring: “How Volume is move?”
What it is: Bar color reflects relative volume; inside bars are black. The dashboard also shows Volume and “Volume vs Prev.”
Why it helps: Patterns without volume often fade; volume validates strength and intent of moves.
⏩ How to use:
Favor entries where imbalance/OB/liquidity-grab coincide with higher volume. If volume is weak, reduce size or skip.
🧲 BSL/SSL liquidity pools: “Fishing for stops”
What it is: Equal highs cluster stops above (BSL); equal lows cluster stops below (SSL). system plots these and highlights the nearest one (“magnet”).
Why it helps: Price often sweeps these pools to trigger stops before reversing. This is a prime trap-reversal location.
⏩ How to use:
Watch nearest BSL/SSL. If price wicks through and closes back inside, anticipate a reversal. Trade reaction, not first poke. When price closes beyond, consider that pool mitigated and move on.
🟢🔴 Advanced liquidity grab: “Catch fakeout”
What it is: Bullish grab = makes a new low beyond a prior low but closes back above it, with a long lower wick, small body, and higher volume. Bearish is mirror. Labeled automatically.
Why it helps: It exposes trap moves (stop hunts) and often precedes true direction.
⏩ How to use:
Best when it aligns with a nearby imbalance/OB and supportive volume. Enter on reversal candle break or on retest. Stop goes beyond sweep wick.
🧠 Smart candlestick patterns (only in right place)
What it is: Engulfing, Hammer, Shooting Star, Hanging Man, Doji (with high volume), Morning/Evening Star, Piercing—but marked “effective” only if context (swing/trend/location) agrees.
Why it helps: same pattern in the wrong place is noise; in the right place, it’s signal.
⏩ How to use:
Location first (BSL/SSL/OB/imbalance), then pattern. Treat pattern as trigger/confirmation—one fresh label shows to keep chart clean.
🧭 Dashboard: “Context in a glance”
⏩ Reversal Level: current swing anchor—expect turns or reactions nearby; great for alerts and planning.
⏩ Volume vs Prev + Volume: Strength meter for signal candle—higher adds conviction.
⏩ Nearest Pool: next “magnet” area—look for sweeps/rejections there.
🧩Step-by-step trading flow (with mindset)
⏩ Set bias: HH/HL = long bias, LH/LL = short bias. Counter-trend only on clean sweeps with strong confirmation.
⏩ Find magnet: Check Nearest Pool (BSL/SSL). Focus attention there; it saves screen time.
⏩ Wait for event: Look for a sweep/grab label, or sharp rejection at pool/OB/imbalance. Avoid FOMO.
⏩ Add confluence: Stack 2–3 of these—imbalance box, OB, contextual pattern, supportive volume.
⏩Plan entry: Bullish: trigger above reversal candle high or take retest of FVG/OB. Stop below sweep wick/zone. Target at least 1:1.5–1:2.
Bearish: mirror above.
⏩Manage smartly: Take partials, move to breakeven or trail thoughtfully. Don’t drag stops inside zone out of emotion.
🎛️ Parameter tuning (to reduce human error)
⏩ swingLen: Smaller = faster but noisier; larger = cleaner but slower. Backtest first, then go live.
⏩ Tolerance (ATR or percent): ATR tolerance adapts to volatility (good for fast markets and lower TFs). Start around 0.15–0.30. In calm markets, try percent 0.05–0.15%.
⏩ minBarsGap: Start with 3–5 so equal highs/lows are truly equal—reduces false pools.
❌Common mistakes → ✅ Better habits
⏩Chasing every breakout → Wait for sweep/rejection, then confirm.
⏩Ignoring volume → Validate strength; cut size or skip on weak volume.
⏩Losing history of pools → If reviewing/backtesting, keep mitigated pools visible (dashed/faded).
⏩Over-tight tolerance/too small swingLen → Increases false signals; backtest to find balance.
📝 checklist (before entry)
⏩ Is there a nearby BSL/SSL and did a sweep/grab happen there?
⏩ Is there a close imbalance/OB that price can retest?
⏩ Do we have an effective pattern plus supportive volume?
⏩Is the stop beyond the wick/zone and RR ≥ 1:1.5?
•?((¯°·._.• 🎀 𝐻𝒶𝓅𝓅𝓎 𝒯𝓇𝒶𝒹𝒾𝓃𝑔 🎀 •._.·°¯((?•

ICT CRT Model Range with EquilibriumICT CRT Model Range with Equilibrium Indicator
This indicator calculates and displays the high, low, and equilibrium levels within a custom-defined session (9:00 am to 10:00 am New York Time and the lines will stop appearing at 16:00pm ). It draws horizontal lines to represent the session's range and marks the equilibrium point as a reference.
What is CRT (Candle Range Theory)?
Candle Range Theory (CRT) is based on the concept that every candle on any timeframe forms its own range. These ranges can either be manipulated—through strategies like Turtle Soup—or broken, resulting in price movements such as engulfing patterns, breakouts, and retests beyond the candle's high or low.
CRT is commonly visualized as a 3-candle model, but it can include more candles due to the presence of inside bars. An inside bar is a candle whose high is not higher than the previous candle's high and whose low is not lower than the previous candle's low.
The CRT model follows the A-M-D structure:
Accumulation (A): The first candle or group of candles (inside bars) represents market consolidation.
Manipulation (M): The second candle signals a false move, often a Turtle Soup setup designed to trap traders.
Distribution (D): The third candle confirms the true market move, breaking out of the range and establishing the trend.
Customizable Settings:
Line Colors: Choose your preferred colors for the high, low, and equilibrium lines.
Line Widths: Adjust the thickness of the lines for better visibility.
Line Styles: Select from solid, dotted, or dashed styles for each line.
Label Settings: Customize the text and colors of the labels for the high, low, and equilibrium points.
Traders can easily modify these settings to suit their visual preferences and trading strategies. This indicator is ideal for identifying price action within a specific range, offering clear visual cues for potential CRT Setup.

Swing Trend AnalysisIntroducing the Swing Trend Analyzer: A Powerful Tool for Swing and Positional Trading
The Swing Trend Analyzer is a cutting-edge indicator designed to enhance your swing and positional trading by providing precise entry points based on volatility contraction patterns and other key technical signals. This versatile tool is packed with features that cater to traders of all timeframes, offering flexibility, clarity, and actionable insights.
Key Features:
1. Adaptive Moving Averages:
The Swing Trend Analyzer offers multiple moving averages tailored to the timeframe you are trading on. On the daily chart, you can select up to four different moving average lengths, while all other timeframes provide three moving averages. This flexibility allows you to fine-tune your analysis according to your trading strategy. Disabling a moving average is as simple as setting its value to zero, making it easy to customize the indicator to your needs.
2. Dynamic Moving Average Colors Based on Relative Strength:
This feature allows you to compare the performance of the current ticker against a major index or any symbol of your choice. The moving average will change color based on whether the ticker is outperforming or underperforming the selected index over the chosen period. For example, on a daily chart, if the 21-day moving average turns blue, it indicates that the ticker has outperformed the selected index over the last 21 days. This visual cue helps you quickly identify relative strength, a key factor in successful swing trading.
3. Visual Identification of Price Contractions:
The Swing Trend Analyzer changes the color of price bars to white (on a dark theme) or black (on a light theme) when a contraction in price is detected. Price contractions are highlighted when either of the following conditions is met: a) the current bar is an inside bar, or b) the price range of the current bar is less than the 14-period Average Daily Range (ADR). This feature makes it easier to spot price contractions across all timeframes, which is crucial for timing entries in swing trading.
4. Overhead Supply Detection with Automated Resistance Lines:
The indicator intelligently detects the presence of overhead supply and draws a single resistance line to avoid clutter on the chart. As price breaches the resistance line, the old line is automatically deleted, and a new resistance line is drawn at the appropriate level. This helps you focus on the most relevant resistance levels, reducing noise and improving decision-making.
5. Buyable Gap Up Marker: The indicator highlights bars in blue when a candle opens with a gap that remains unfilled. These bars are potential Buyable Gap Up (BGU) candidates, signaling opportunities for long-side entries.
6. Comprehensive Swing Trading Information Table:
The indicator includes a detailed table that provides essential data for swing trading:
a. Sector and Industry Information: Understand the sector and industry of the ticker to identify stocks within strong sectors.
b. Key Moving Averages Distances (10MA, 21MA, 50MA, 200MA): Quickly assess how far the current price is from key moving averages. The color coding indicates whether the price is near or far from these averages, offering vital visual cues.
c. Price Range Analysis: Compare the current bar's price range with the previous bar's range to spot contraction patterns.
d. ADR (20, 10, 5): Displays the Average Daily Range over the last 20, 10, and 5 periods, crucial for identifying contraction patterns. On the weekly chart, the ADR continues to provide daily chart information.
e. 52-Week High/Low Data: Shows how close the stock is to its 52-week high or low, with color coding to highlight proximity, aiding in the identification of potential breakout or breakdown candidates.
f. 3-Month Price Gain: See the price gain over the last three months, which helps identify stocks with recent momentum.
7. Pocket Pivot Detection with Visual Markers:
Pocket pivots are a powerful bullish signal, especially relevant for swing trading. Pocket pivots are crucial for swing trading and are effective across all timeframes. The indicator marks pocket pivots with circular markers below the price bar:
a. 10-Day Pocket Pivot: Identified when the volume exceeds the maximum selling volume of the last 10 days. These are marked with a blue circle.
b. 5-Day Pocket Pivot: Identified when the volume exceeds the maximum selling volume of the last 5 days. These are marked with a green circle.
The Swing Trend Analyzer is designed to provide traders with the tools they need to succeed in swing and positional trading. Whether you're looking for precise entry points, analyzing relative strength, or identifying key price contractions, this indicator has you covered. Experience the power of advanced technical analysis with the Swing Trend Analyzer and take your trading to the next level.

Reversal Points [CC]This original script was created based on a suggestion from @kerpiciwuasile. My original Reversal Points script was removed because I modeled it after an indicator by Demark, but this script will have no such issues. Reversal points are an exciting concept for me because it is such a useful tool when placing trades. This is my first attempt at a new overall layout for my script and I included a bunch of customization so let me know what you think.
My script works by finding lows that are surrounded by bars that have higher lows and highs that are surrounded by lower highs. I use this logic to find short term lows or highs and I use the same concept to find mid-term lows or highs but a mid-term high is a short term high surrounded by lower short term highs and a mid-term low is a short term low surrounded by higher short term lows. And of course this means that long term highs or lows use the same logic to find highs or lows that are surrounded by mid-term highs or lows. I would recommend to buy at the long term low points or sell at the long term high points.
Keep in mind of course that short term highs and lows are very common and reversal points will get rarer as you look for longer term reversal points. I would recommend to experiment and see which reversal points work best for you and of course, know that there is no magical formula to use for all stocks.
Also there are a few scenarios where you want to enable or disable the inside bar setting. You would want to ignore inside bars if the market is currently very volatile or if you are using this indicator on a crypto chart. This is not an exact science but more of a recommendation, so feel free to experiment with it.
Reversal points are crucial for traders as they signal a potential change in the market trend, providing opportunities for entry or exit.
In summary, this code snippet is a powerful tool for traders to detect and visualize reversal points on a trading chart, providing valuable insights into potential trend changes and facilitating more informed trading decisions.
Let me know if you would like me to publish other scripts or if you want me to do something custom for you!

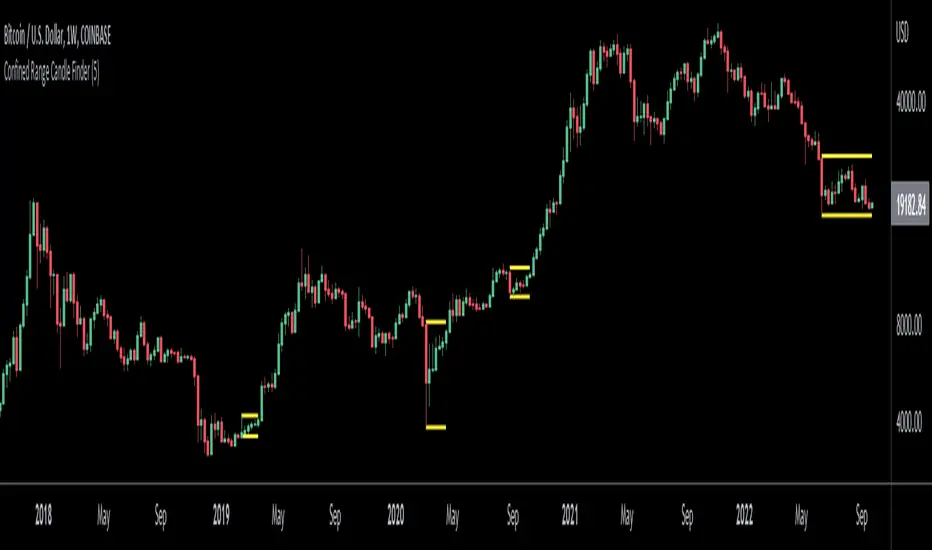
Confined Range Candle FinderThis indicator finds candlesticks which are confined within the range of a previous candlestick. This indicates volatility contraction which often leads to volatility expansion, i.e. large price movements.
While every confined range will contain at least 1 inside bar, this indicator differs from the Inside Bar Finder which only finds consecutive inside bars.
This indicator includes options such as:
- The minimum number of candlesticks confined within the range of a previous candlestick to trigger the indicator
- Labels to indicate the number of confined candles
- Signal lines to indicate the high and low of the containing candlestick
Try out this indicator with different options on different timeframes to see if confined ranges increase the probability of identifying the direction of price movements. Breaks or closes outside signal lines can be used to trigger trade signals.
PopGun Trading, PG Pattern DetectorPopGun Bar Pattern Strategy
PG Trading
The indicator does the following:
It detects the Outside Bar, the smaller inside Bar and the 3rd Pop Gun that is bigger, than the inside Bar.
When the Pop Gun was detected, the indicator will calculate 3 targets for long and short trades.
In our understanding, a Pop Gun is neutral. The next candles after the Pop Gun will decide if the PG breakout is bullish or bearish.
So if one of the next candles after the PG is breaking the high or low of the PG Candle, this is a breakout confirmation and can traded long or short.
We are using the PG Indicator for Stock, Futures and Index Trading.
The Script uses 3 targets per default, but you can extend the target dots up to 6.
If you want to see the targets in plain text, you can activate the PG Box.
The targets are calculated really easy: Just the height of the candle multiplied with 1, 2 and 3 (4,5 and 6 additionally). In some communities there is an ATR calculation for more extended targets but it seems, that the ATR Calculation will sometimes lead to unreachable targets if the ATR is really high intraday...
We trade PopGuns starting at M15 chart. I think PGs smaler than M15 are not worth a trade...
Maybe i will add the ATR Function in the future just to compare the 2 ways to calculate PG targets. We are really doing well with 1,2,3 targets based on the PG Candle size. (Low to High).
Please leave a comment if you have some feature requests or input to make this the best Pop Gun Indicator in Trading View ;-)

Price Action: Inside Bar BoxesThis script automatically draws rectangles around bars inside IB pattern.
Note :: because Pinescript does not allow changes to already drawn charts on historical bars, checkbox "show only last box" doesn't work for arrows

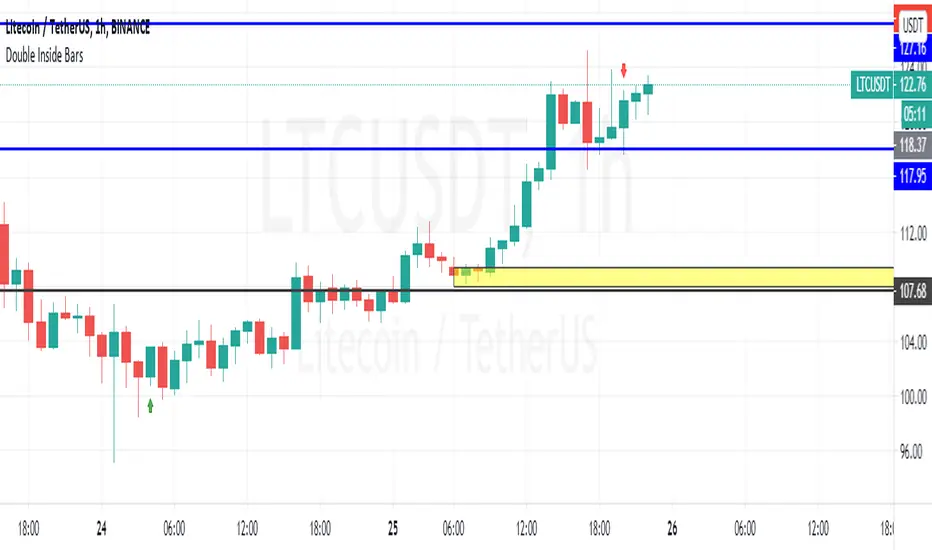
Double Inside BarsShows possible 4th bar movement direction based on 2 previous bars inside the 1st one
CSPDMost Advanced & Accurate CandleStick Pattern Detector
Looking All Over of All Markets for All Important Powerful Reversal | Corrective Patterns (25 type)
Filtering the Results with Optional Features like Oscillator, Bollinger Bands, Volume Confirmation, Prior and Following Candles Confirmation which are Fully Customizable.
With this you can detect:
Hammer | Shooting star
Inverted Hammer | Hanging
Long legged Doji | Dragonfly Doji | Gravestone Doji
Bullish tweezers | Bearish tweezers
Bullish inside bar | Bearish inside bar
Bullish three line strike | Bearish three line strike
Bullish engulfing | Bearish engulfing
Piercing line | Dark cloud cover
Bullish abandoned baby | Bearish abandoned baby
Morning star | Evening star
Three white soldiers | Three black crows
*Bullish kayo | *Bearish kayo
Features:
Prior and Following candles Confirmation
You can set prior and following candle as basic prerequisites for marking candles as pattern to make sure you are at the top or bottom of the trend.
Volume confirmation
You can active volume increasing confirmation for some of pattern with adjustable increase % relative to prior candle | candles.
Oscillator Confirmation
Active oscillator confirmation. Select your approved oscillator from list (Stochastic, RSI, StochRSI, MFI, StochMFI) then enter desired value for marking candles as bullish | bearish pattern.
Bollinger Bands Confirmation
Active BB confirmation. Configure your Bollinger Bands. Now only see the patterns which reached or crossed from Bands. Also you can enable BB clod to have your BB indicator at the same time.
Adjustable Flexibility and Precision
You can set tolerance% for Osc and BB Confirmation - each one separately - for more control.
Self-adaptability
The properties of markets change over time, for example the amplitude of fluctuations and the intensity of movements. The script is designed in such a way that you can examine the price history as a benchmark for changes in market properties to adopt determinants. Also you can control those manually.
Self-regulatory
The user has the ability to change input factors depending on their point of view.
Behind the pattern recognition algorithms, there are relationships and similarities in their appearance that cause them to be influenced by each other. Simultaneously with changing the determining factors of each pattern by you, script automatically adjusts other details in accordance with your changes.
Alerts
You can set for type of pattern or each one of pattern have been detected.
Fully Costumizable
All of these options can be change and adjust.
Note 1.
The patterns are based on extensive study of reference and famous sources and the experience of me and my friends in trading and analysis with price action methods.
Note 2.
Due to the Pine limitations in the number of outputs | plots for each script, our attempt has been made to select the best and most important patterns.
Note 3.
So far, many scripts have been written in this field, but our experience with all of them and even the build in version was not satisfactory, and this was the initial motivation for making the script.
We strive to improve progress and elimination of shortcomings and we will continue to make this better.
Note 4.
Through personal experience and based on the principles of market and candlestick psychology, we discovered a new type of pattern and named it as Kayo.
kayo is a two candle pattern which formed when:
1.We have a pivot point with prior candles as left bars and following candles as right bar. Pivot candle called as second candle.
2.In a bullish kayo, first candle must closed descending and second candle must closed as ascending. For bearish kayo vise versa.
3.In a bullish kayo, second candle's lower wick must be longer then upper wick.
4. A pattern marked as kayo when its conditions do not correspond to any of the other patterns(include the confirmation that user added), ie it has the last naming priority over the other patterns.
Note 5.
When you active confirmation options for patterns like hammer, engulf and etc which they conditions are like kayo in some extent, if they can't pass the confirmation steps, they can be marked as kayo pattern.
Note 6.
If you active volume confirmation for Three white soldiers | Three black crows, the confirmation get passed if the volume of forth or third candle increased as value as entered relative to volume EMA3 of 3 candles.
Note 7.
In a bullish pattern all highs of following candles MUST be higher than prior highs and all lows of following candles MUST be higher than prior lows. For bearish patterns vise versa.
This type of confirmation depends on High and Low NOT close!
Gift to price action lovers!
Support us with your like and comments. let us know your experience, points and idea to make this better together.